The graph view feature of TDA allows you to visualize your data in a variety of graph formats such as pie charts, bar charts, line graphs, etc. similar to what you may have seen within Microsoft® Excel. In the following sections we will walk through a basic example of creating a pie chart displaying a breakdown of cases based on medical outcomes coded as “No effect”, Minor effect”, “Moderate effect”, and “Major effect”.
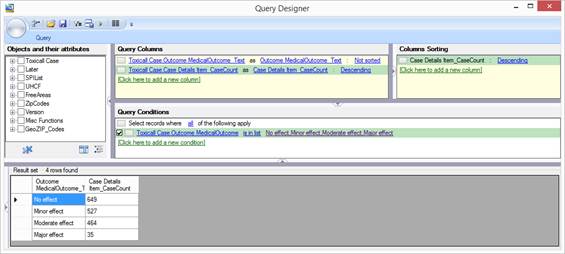
For this example a simple query has been created and saved within TDA. Notice the query is only returning a total case count for the four medical outcomes of interest.