A two column data graph is a simple graph that takes advantage of data sets where only two columns of information exist and need to be visually represented.
The process for creating a basic two column data graph is outlined in the following steps.
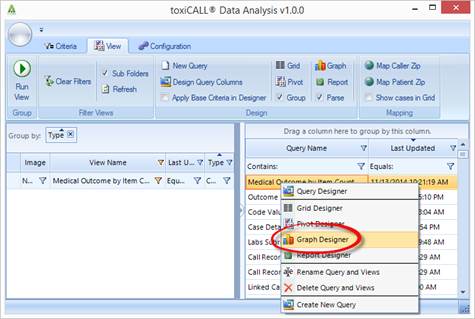
1. Locate and right click on the query you would like to graph. In our example this would be the “Medical Outcome by Item Count” query previously created in the section.
2. The “Char Editor” window will appear.
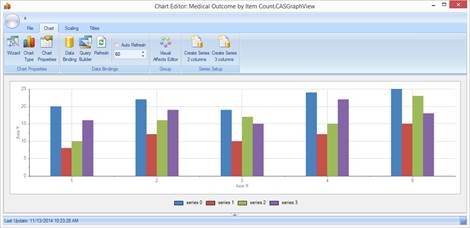
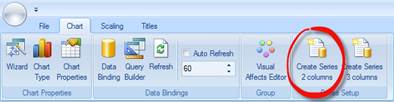
3. Select the “Create Series 2 columns” icon as we are only interested in creating a graph based on a two column data set.
4. The chart editor window will update to what appears to be a blank graph. This is because we have not yet selected the appropriate “Chart Type”.
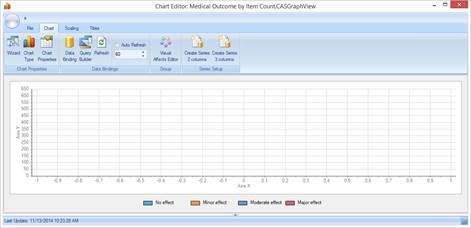
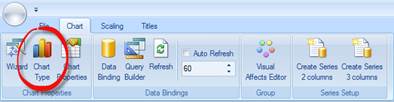
5. Select the “Chart Type” icon to display the various chart types available.
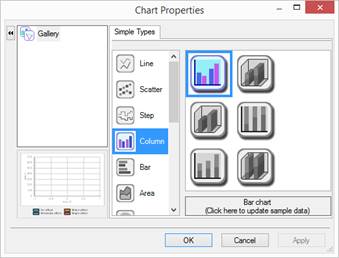
6. The “Chart Properties” window will appear.
7. Update the selection to a 3D-Pie chart for this example.
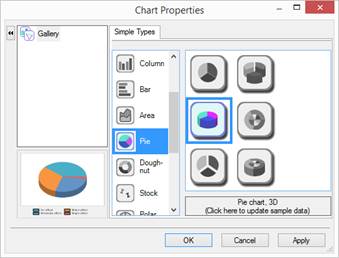
8. Press “OK” to accept the change.

The pie chart desired is now displayed and ready to be exported or saved for future use.