The pivot table view supports viewing data in graph format for basic visual representation needs. If you are interested in a robust graph, we suggest looking into using the “Graph View” feature of toxiCALL® Data Analysis.
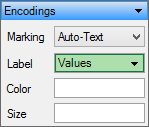
1. With the pivot table open, locate the “Encodings” area located in the lower left portion of the design window.
2. Select the “Marking” drop down and choose the style of graph you are interested in viewing. In this example, we will select “Bar”.
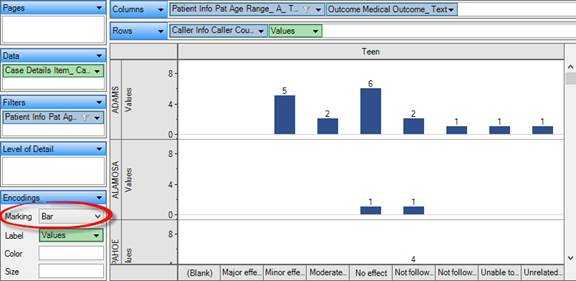
3. The pivot table view updates automatically to show the information in “Bar” chart form.
Reminder: While the charting capabilities of the pivot view may accomplish your business goal, please keep in mind TDA supports a “Graph” view that provides more robust features.