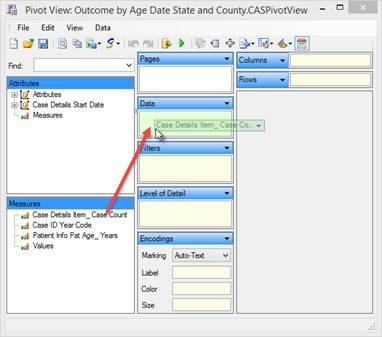
The first step in creating a basic pivot table is to select the data you wish to measure against. As you may recall from the introduction we are interested in reporting on case counts, therefor we will be using the “Item_CaseCount” measure to aggregate our data.
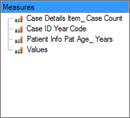
1. Locate the “Measures” area.
2. Drag the “Case Details Item_CaseCount” measure to the “Data” area of the pivot designer.
3. Depending on the amount of data retuned by the query, it may take a few moments for the overall case count to appear in the pivot table area.
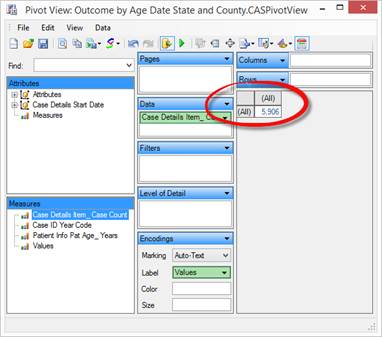
4. The data measure of “Item_CaseCount” is now implemented and active with a count of 5,906 cases.