The grid view supports grouping column data as a single or multiple level grouping. In this example we will demonstrate grouping Caller County data so that viewing data by each county is easier and more efficient.
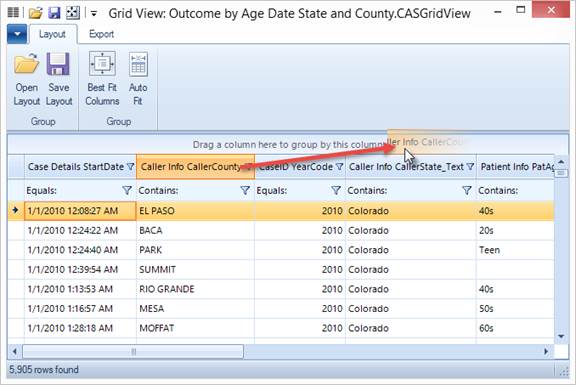
1. Open the grid view window and locate the column header of the data you would like to group. Select and drag the column header into the “Grouping” area denoted by the text “Drag a column here to group by this column.”
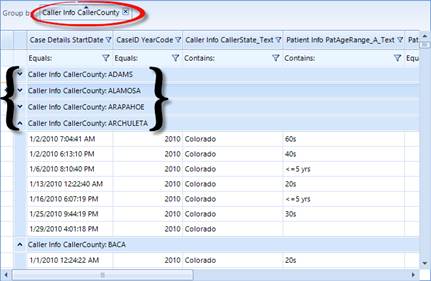
2. The grid view will update to now group information by the Caller County.
3. If you would like to add another level of grouping, simply drag the column header into the grouping area.
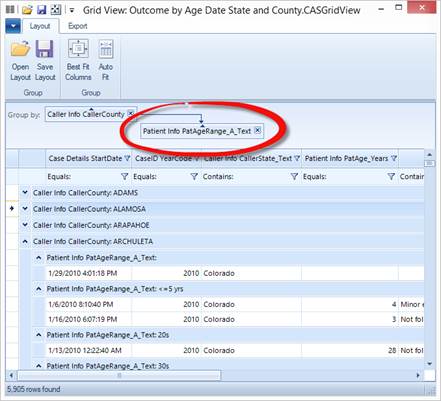
4. The grid view now displays the information grouped first by Caller County, then by Age Range.