The Graph option in Batch Reporting allows the user to graph the results of the batch into an Excel spreadsheet.
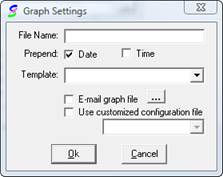
Clicking on the 3-dot button for the “Graph” output option opens the “Graph Settings” window. This window allows the user to select the settings they desire and have them applied to their report.

Please refer to the below information on how to populate/use each area and field in the window.
File Name: The file name field is used to setup the desired file name for the graph.
Prepend:
Date: Determines if the date of the report will be prepended to the file name.
Time: Determines if the time of the report will be prepended to the file name.
Template:
E-mail graph file:
Use customized configuration file:
-- (This section to be completed at a later date.) --