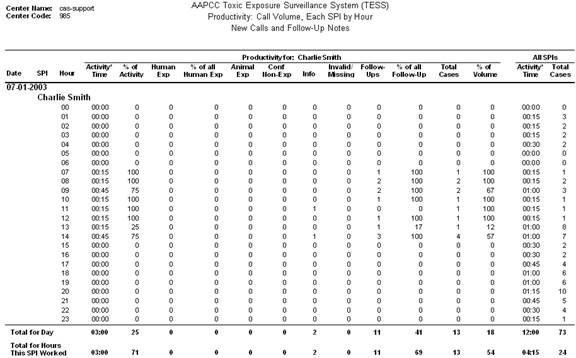
Report 085a offers users a way to see what activities a SPI is performing for a specific date range and time range.

As seen in the above screen shot, report 085a displays a complete breakdown of activities of user “Charlie Smith” for July 7, 2003. Using the columns listed a user can see counts and percentages of different call types across a 24-hour spectrum. The bottom of the report also offers a “Total for Day” and “Total for Hours This SPI Worked” These data rows show data based on an entire 24-hour period and for all SPIs during the hours the SPI listed was logged in.
“Total for Hours This SPI Worked” is showing data for all SPIs logged in and working during the same times that “Charlie Smith” was logged in and working. 07:00 – 14:00.
When running this report, you may decide to set the “Initial SPI” field to a specific SPI name. Report 085a will display all SPIs that performed a follow-up on the case that was created by the initial SPI if you filter by that initial SPI. For example if SPI “Charlie Smith” creates one exposure case and assigned it to SPI “Susan Ford”, when the report is ran using Initial SPI as “Charlie Smith”, report 085a does not show “Susan Ford”. Once “Susan Ford” performs the assigned follow-up on the case, she is now listed on the report when the initial SPI is set to “Charlie Smith”.
If you feel seeing multiple SPIs when filtering by initial SPI is confusing, CAS suggests that you try to run the report using a specific date or date range, rather than initial SPI.
Additionally, the “Activity Time” column is not logging the time that a SPI is logged into the system. The report is only logging the actual time the SPI is working on charts in 15 minute intervals.